
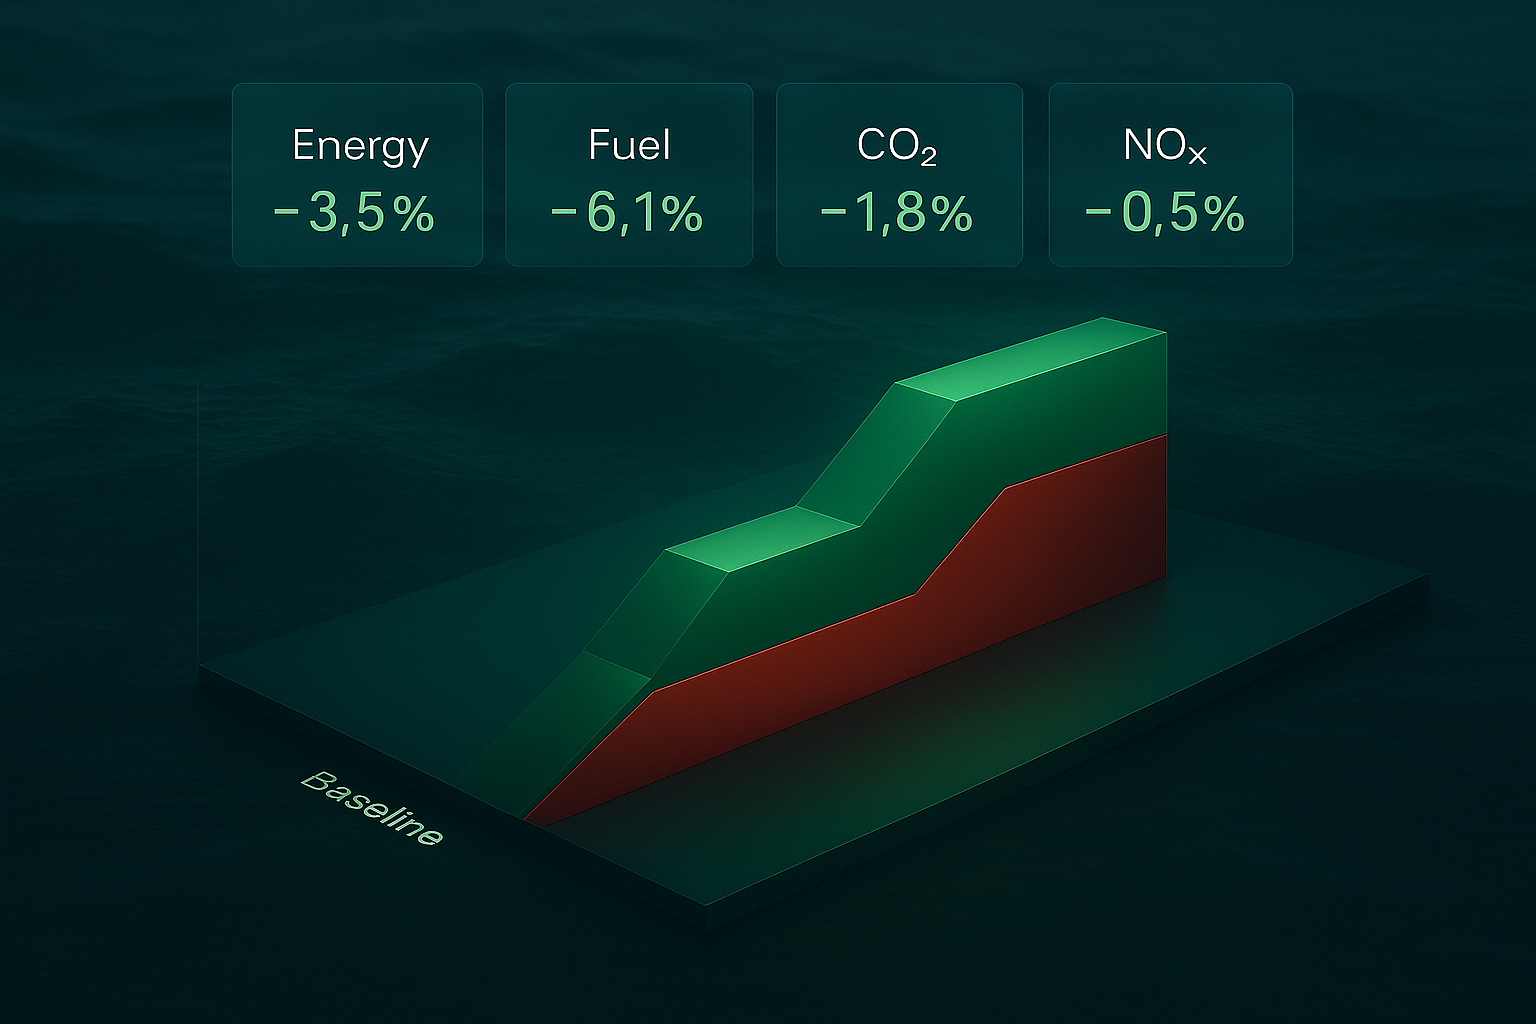
Baseline Comparison: Compare data across different periods and rigs

From Data to Decisions: Comparing Asset Performance with OX Energy Management Software
Comparing asset performance is one of the most effective ways to identify inefficiencies, validate improvements, and support better operational decisions. OX Energy Management Software’s Baseline Comparison feature is built to do exactly that, enabling users to compare performance across rigs, time periods, and targets, while increasingly leveraging AI‑driven insights and predictions where applicable.
This is not just about viewing data. It is about putting performance into context and turning comparisons into actionable insight.
What Can You Compare?
OX Energy Management Software allows users to define baselines flexibly, depending on the operational question at hand:
- Same rig, different time periods
Ideal for tracking performance over time and assessing the impact of operational or technical changes. - Different rig, same time period
Enables direct benchmarking across assets in the fleet. - Different rig, different time periods
Supports broader performance comparisons across operational contexts. - Static target baseline
Allows progress tracking against predefined goals, standards, or contractual targets.
This flexibility ensures comparisons can be tailored to real operational needs, whether the goal is benchmarking, target setting, or identifying deviations and outliers.
How Is the Comparison Visualized?
Baseline comparisons are presented across five core modules, each highlighting performance from a different operational perspective
- Periodic Overview
High‑level view of total energy consumption and emissions. - Drilling Activities
Energy consumption categorized according to specific operational activities. - Equipment Categories
Detailed insights into energy use by equipment type. - Power Management
Engine performance metrics such as average load, SFOC, and number of engines online. - Analytics
AI‑supported analysis highlighting inefficiencies and estimating potential savings relative to the selected baseline.
Together, these modules provide both transparency and depth, moving from overview to root‑cause analysis.
Example: Lighting Category Comparison
As a practical example, consider the Equipment Categories module.
In this scenario, lighting energy consumption is compared between two identical rigs operating during the same period. The selected rig consistently shows higher consumption than its baseline counterpart.

This immediately raises relevant operational questions:
- Are lighting systems correctly configured and optimized?
- Do operating conditions differ between rigs?
- Could autmoation, scheduling or control logic reduce unnecessary usage?
By filtering on the Lighting category and using incremental chart views,users can pin point exactly when and where excess consumption occurs, providing a solid basis for further investigation.
Exploring Engine Efficiency with Power Management and Analytics
Step 1: Identify patterns in Power Management
The Power Management module allows users to compare engine utilization metrics across rigs. In the example shown, the selected rig is operating with more engines online than its baseline, resulting in a lower average engine load.

This pattern can indicate inefficiencies and suggests an opportunity to review engine dispatch strategies, particularly during stable or low‑load operations.
Step 2: Quantify opportunities with AI‑driven Analytics
To explore this further, users can switch to the Analytics module. By selecting the focus area “Too many engines running”, OX Energy Management Software applies AI‑based analysis to estimate potential fuel savings achievable through improved engine utilization.

Rather than prescribing a fixed solution, the system highlights where optimization potential exists—supporting data‑driven discussions and informed operational decisions.
From Comparison to Prediction
Baseline Comparison lays the foundation for AI‑driven performance predictions. By understanding how assets perform relative to peers, history, and targets, OX Energy Management Software can increasingly
- Identify emerging inefficiencies earlier
- Highlight deviation trends before they escalate
- Support predictive insights that guide proactive decision‑making
OX Energy Management Software’s Baseline Comparison feature is designed for meaningful, operationally relevant comparisons. Whether benchmarking rigs, tracking performance over time, or measuring progress against targets, it helps transform raw data into insight, and insight into action.
Want to see how this could work for your operations?
Get in touch for a demo and discover how OX Energy Management Software helps you compare with purpose and act with confidence.


Have a Question?